NVIDIA Stock Analysis
(1999 – Q1 2025)
Interactive insights, visualized growth, and market shifts
Welcome to the Journey
This project explores how NVIDIA’s stock evolved over time with interactive visuals and insights. Let’s break it down section by section.
Adjusted Close Price Over Time

Insights
- Insight 1: The adjusted close price remained flat until mid-2016 before showing rapid growth.
- Insight 2: Massive surge after 2020 aligns with the AI + data center wave.
- Insight 3: Short dips during 2022 and early 2023 before recovering to all-time highs.
Yeah... here we are
Most people don’t know what these numbers mean, I didn’t either. But here’s a quick rundown that’ll help you understand the visuals better:
- Open: Price when the stock started trading that day.
- Close: Price when the market closed.
- Adjusted Close: Close price adjusted for stock splits/dividends, more accurate for analysis.
- Volume: Total shares traded that day (high = hype).
- Daily Range: The difference between High and Low price in one day, shows volatility.
Volume Traded Over Time
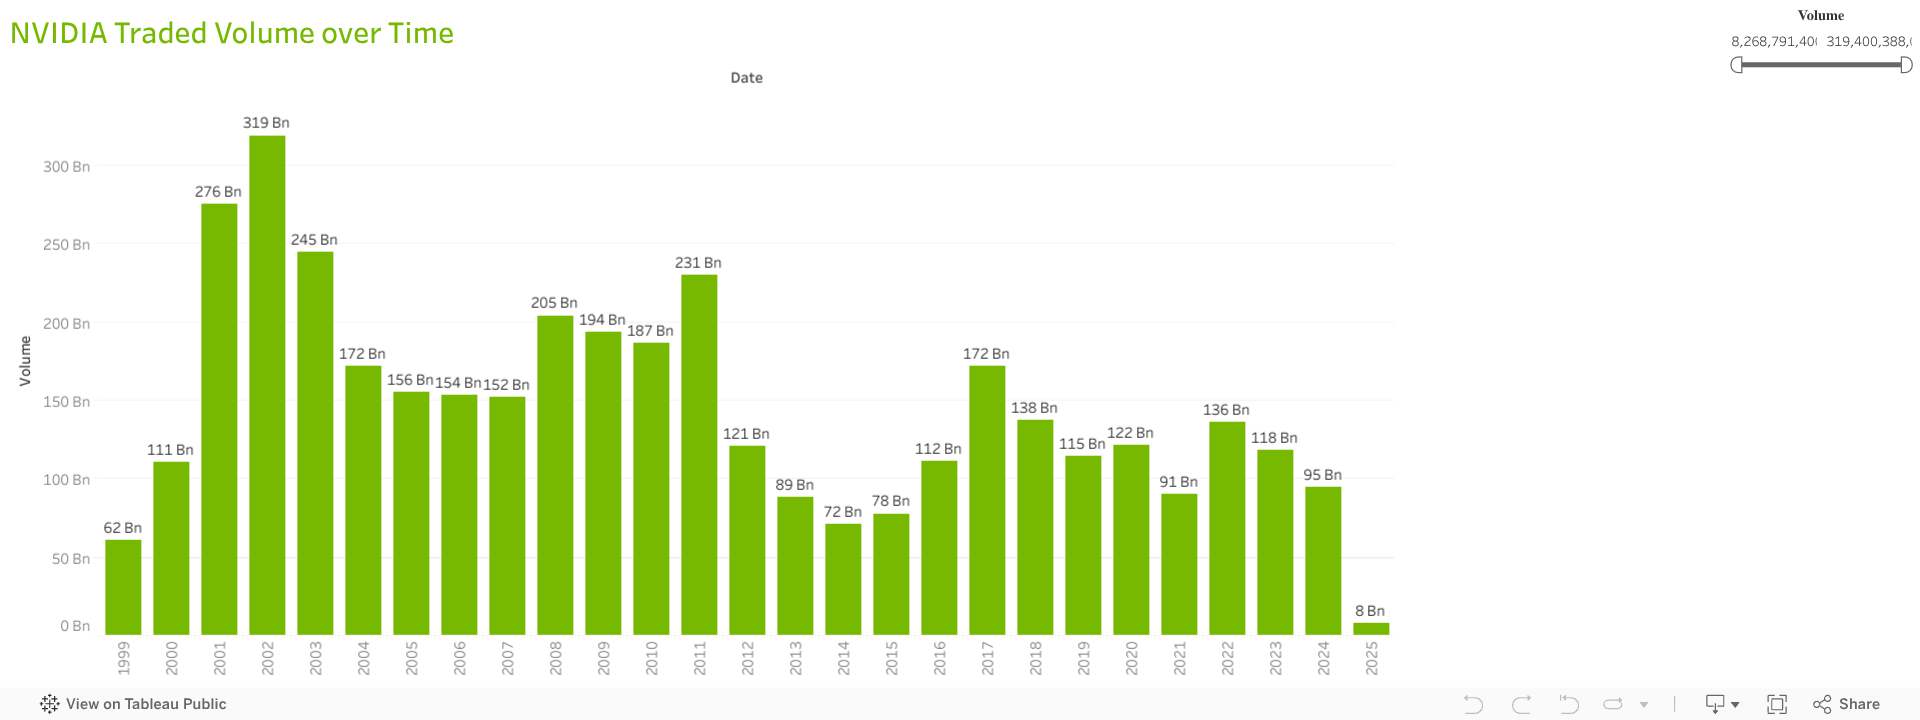
Insights
- NVIDIA saw its highest trading volume in the early 2000s, during the dot-com era.
- Post-2020 volume dipped even during price surges — likely due to institutional trading.
- Spikes in 2018 and 2023 reflect product launches and AI investor rush.
Daily Price Range (High – Low)

Insights
- Before 2019, NVIDIA's daily price range was below $2 — stable and predictable.
- Post-2020, the daily range consistently rose, peaking above $13 during heavy AI investor action.
- Spikes in range often aligned with quarterly earnings or tech announcements.
Volume vs Daily Price Range

Insights
- Post-2022, price volatility spiked even as volume declined — indicating fewer trades but higher risk moves.
- High volume in the early 2000s didn’t always lead to big price swings, showing more stable investor sentiment back then.
- Biggest overlap of high volume + high range days happened during AI boom peaks and earnings reports in 2023–2024.
Explore the Full Interactive Dashboard
Dive deeper into NVIDIA’s performance by interacting with the full dashboard below — filter by year, spot volatility spikes, and compare trends across metrics.